Adding an Analytics Dashboard for Toy Boat (in an hour)
A few weeks ago I wanted better visibility into how families are using Toy Boat — the app for families to play together from anywhere. Rather than starting from scratch, I tried Lovable and ended up building a working analytics dashboard in about an hour during one of Bethany Crystal's Build First AI workshops. I had some extra Lovable credits, so why not?
You can see the dashboard live here: toy-boat-analytics.lovable.app.
The Setup
I kept the stack intentionally simple and close to the product:
- Uses the same login as Toy Boat. If you can sign into the app, you can sign into the dashboard.
- Server-side check verifies you're an admin before granting access.
- All data comes directly from Supabase — no separate analytics database to maintain.
This meant I could ship something useful fast, without introducing new systems that would drift out of sync.
What I Built During the Workshop
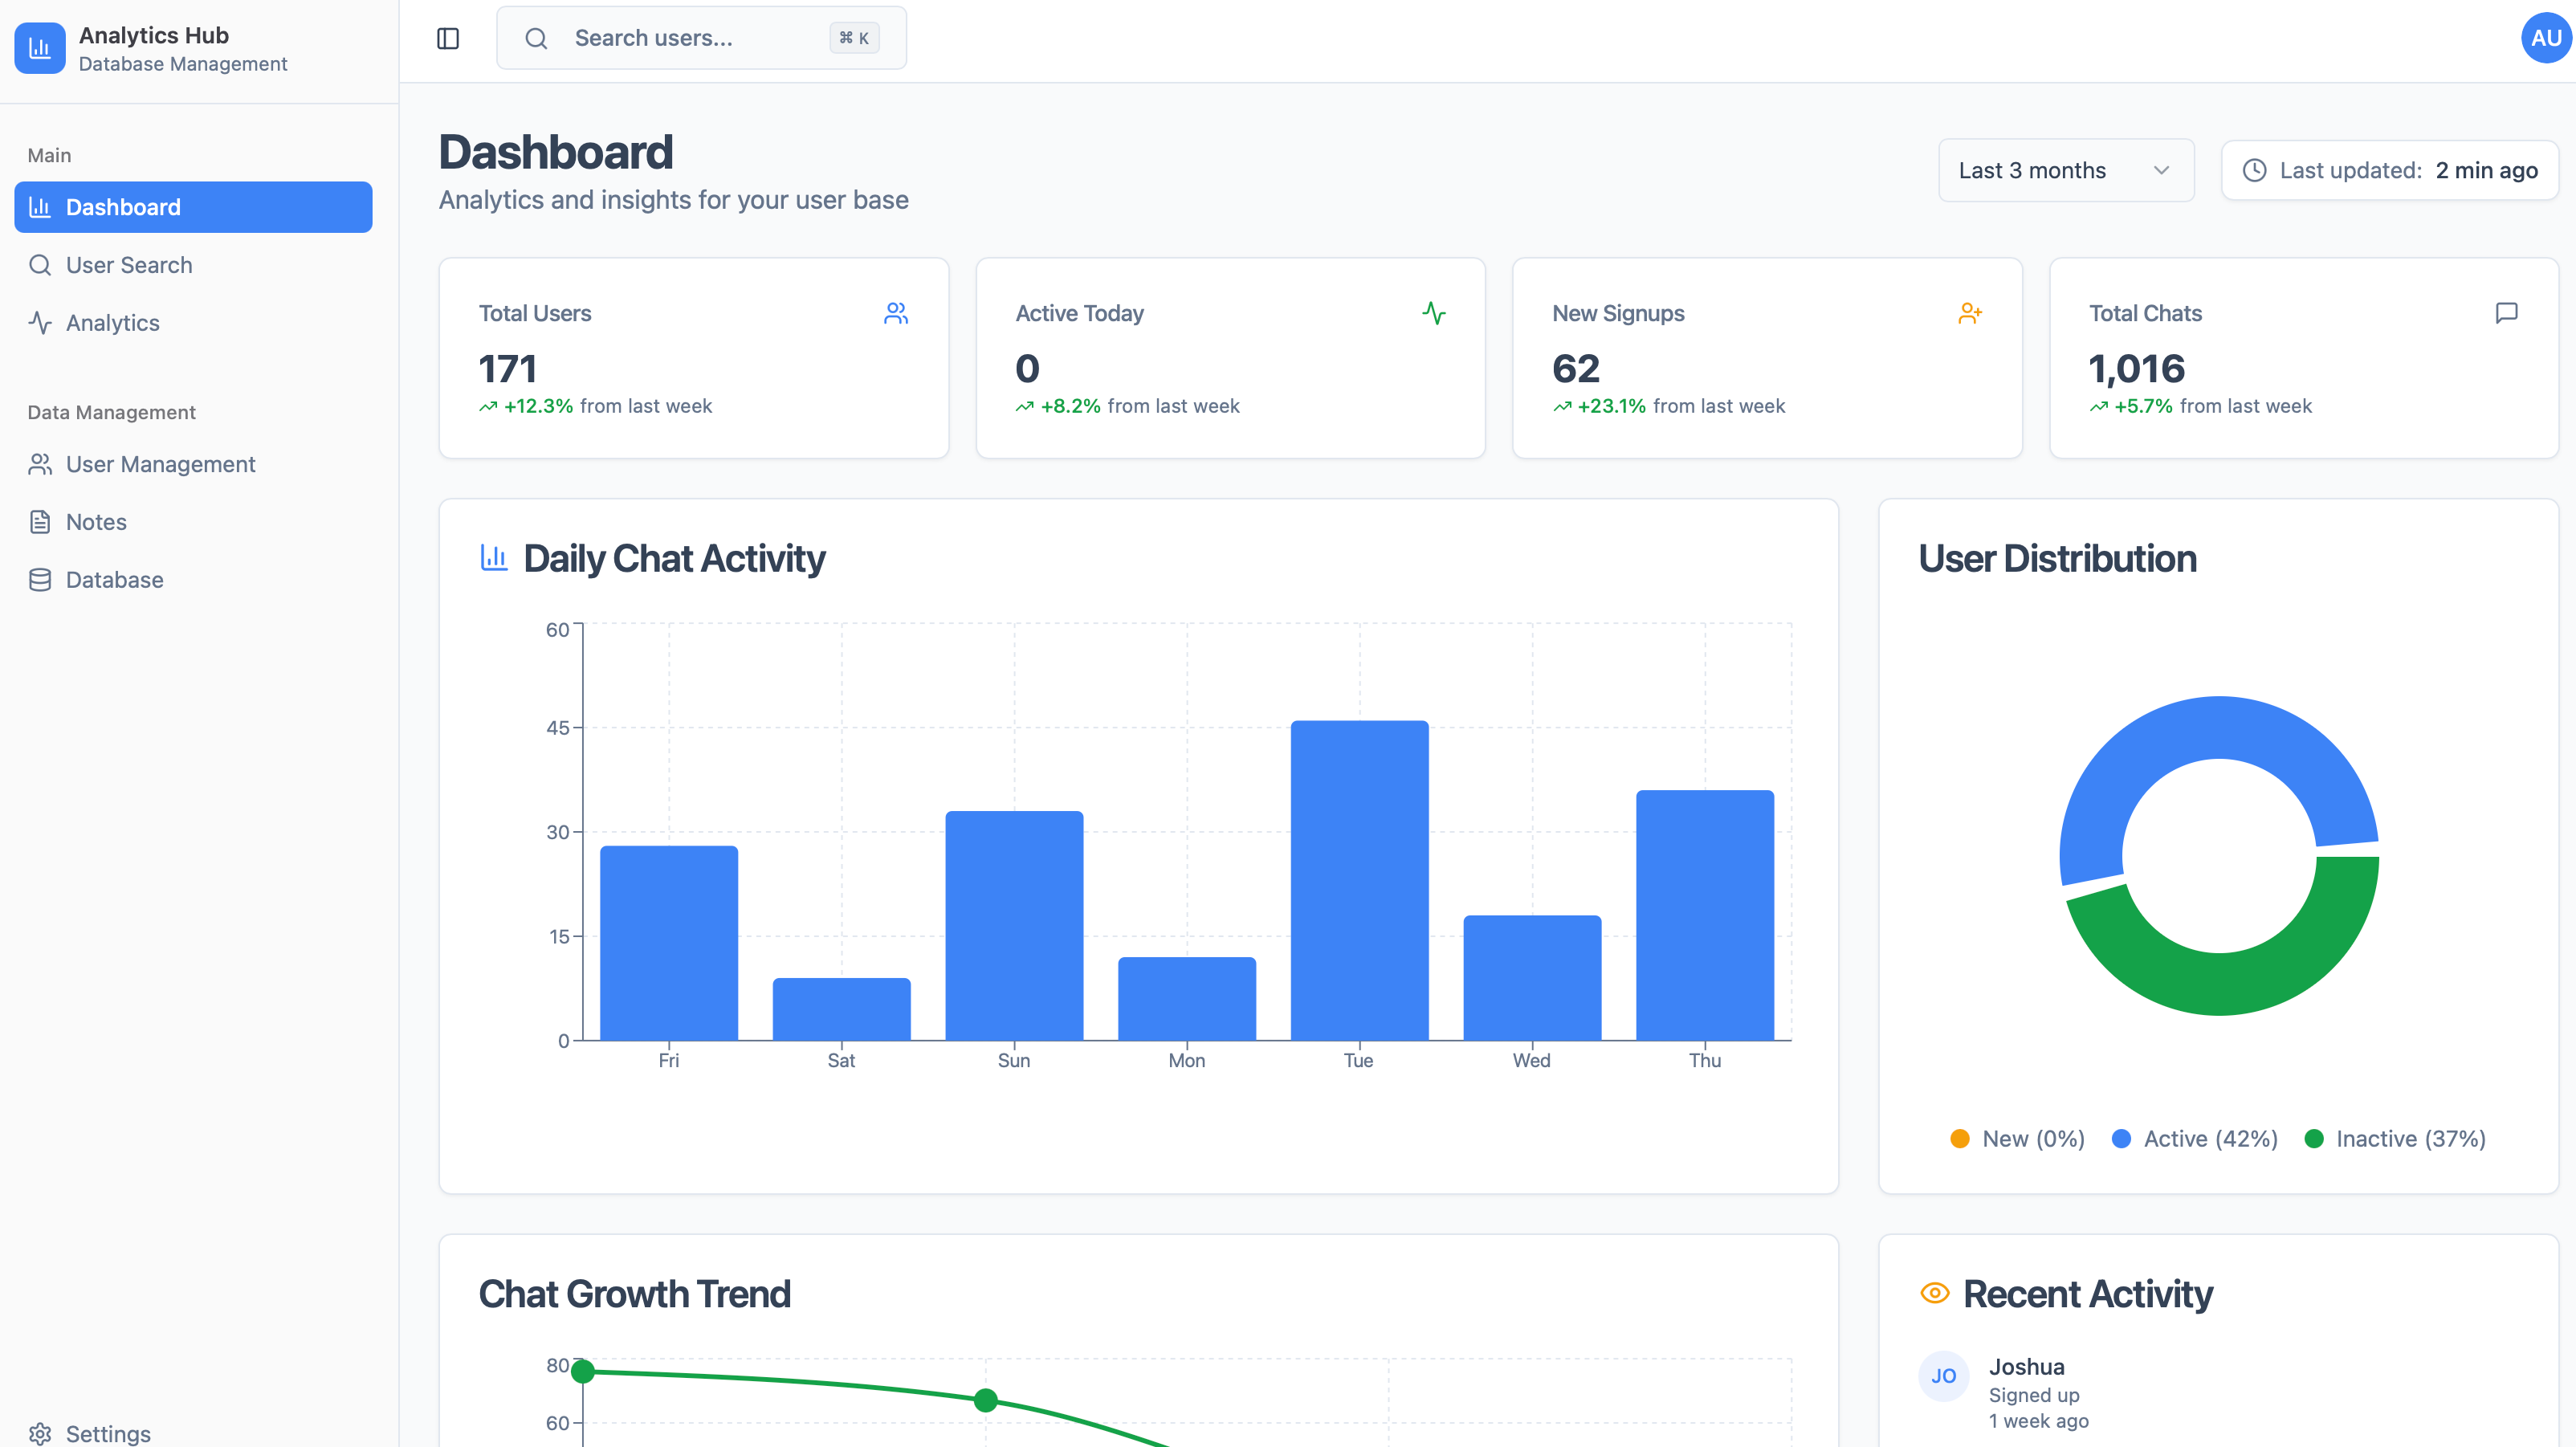
In roughly an hour, I had Lovable scaffold the dashboard, wire up auth, and render the first charts: total users, daily chat activity, new signups, user distribution, and recent activity. The starter UI was clean enough that I focused most of my time on queries and getting the numbers right.
A Little More Polish
After the workshop, I spent a couple more hours tightening things up and adding a demo mode so I could share the dashboard publicly without exposing private data. Demo mode swaps the data layer for realistic-but-fake numbers while keeping the real UI and interactions.
Why This Approach Works
- Single source of truth: queries read from Supabase directly; no ETL.
- Familiar login flow: no new accounts for the team to manage.
- Fast iteration: Lovable handled most of the scaffolding so I could spend time on metrics.
Big thanks to Build First for the push to just ship it!